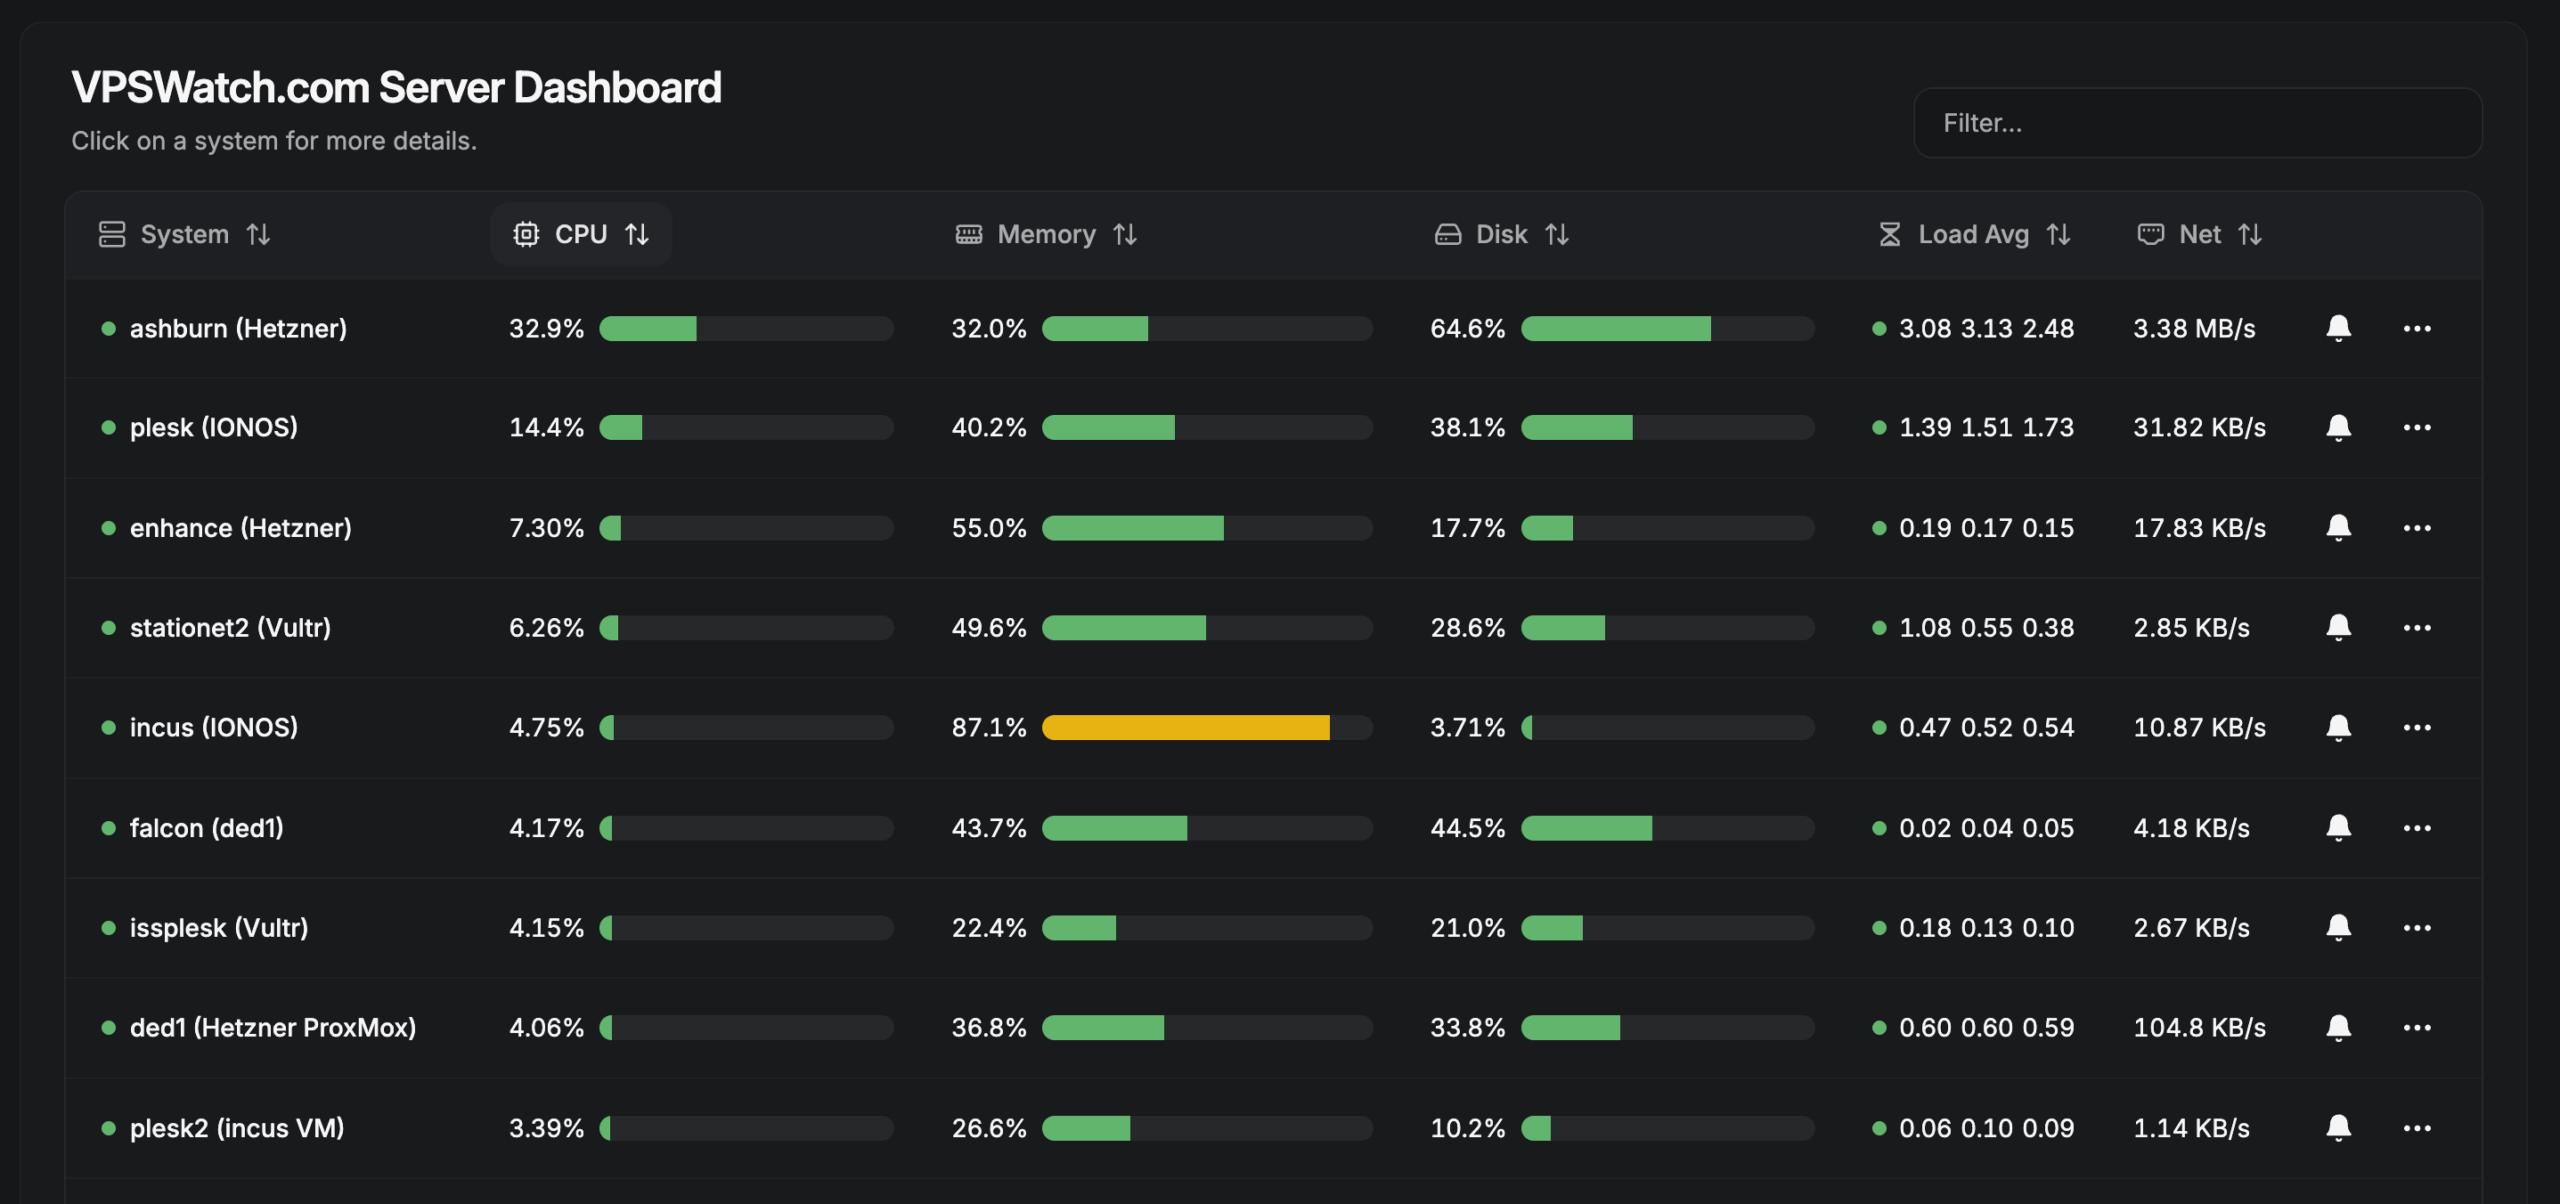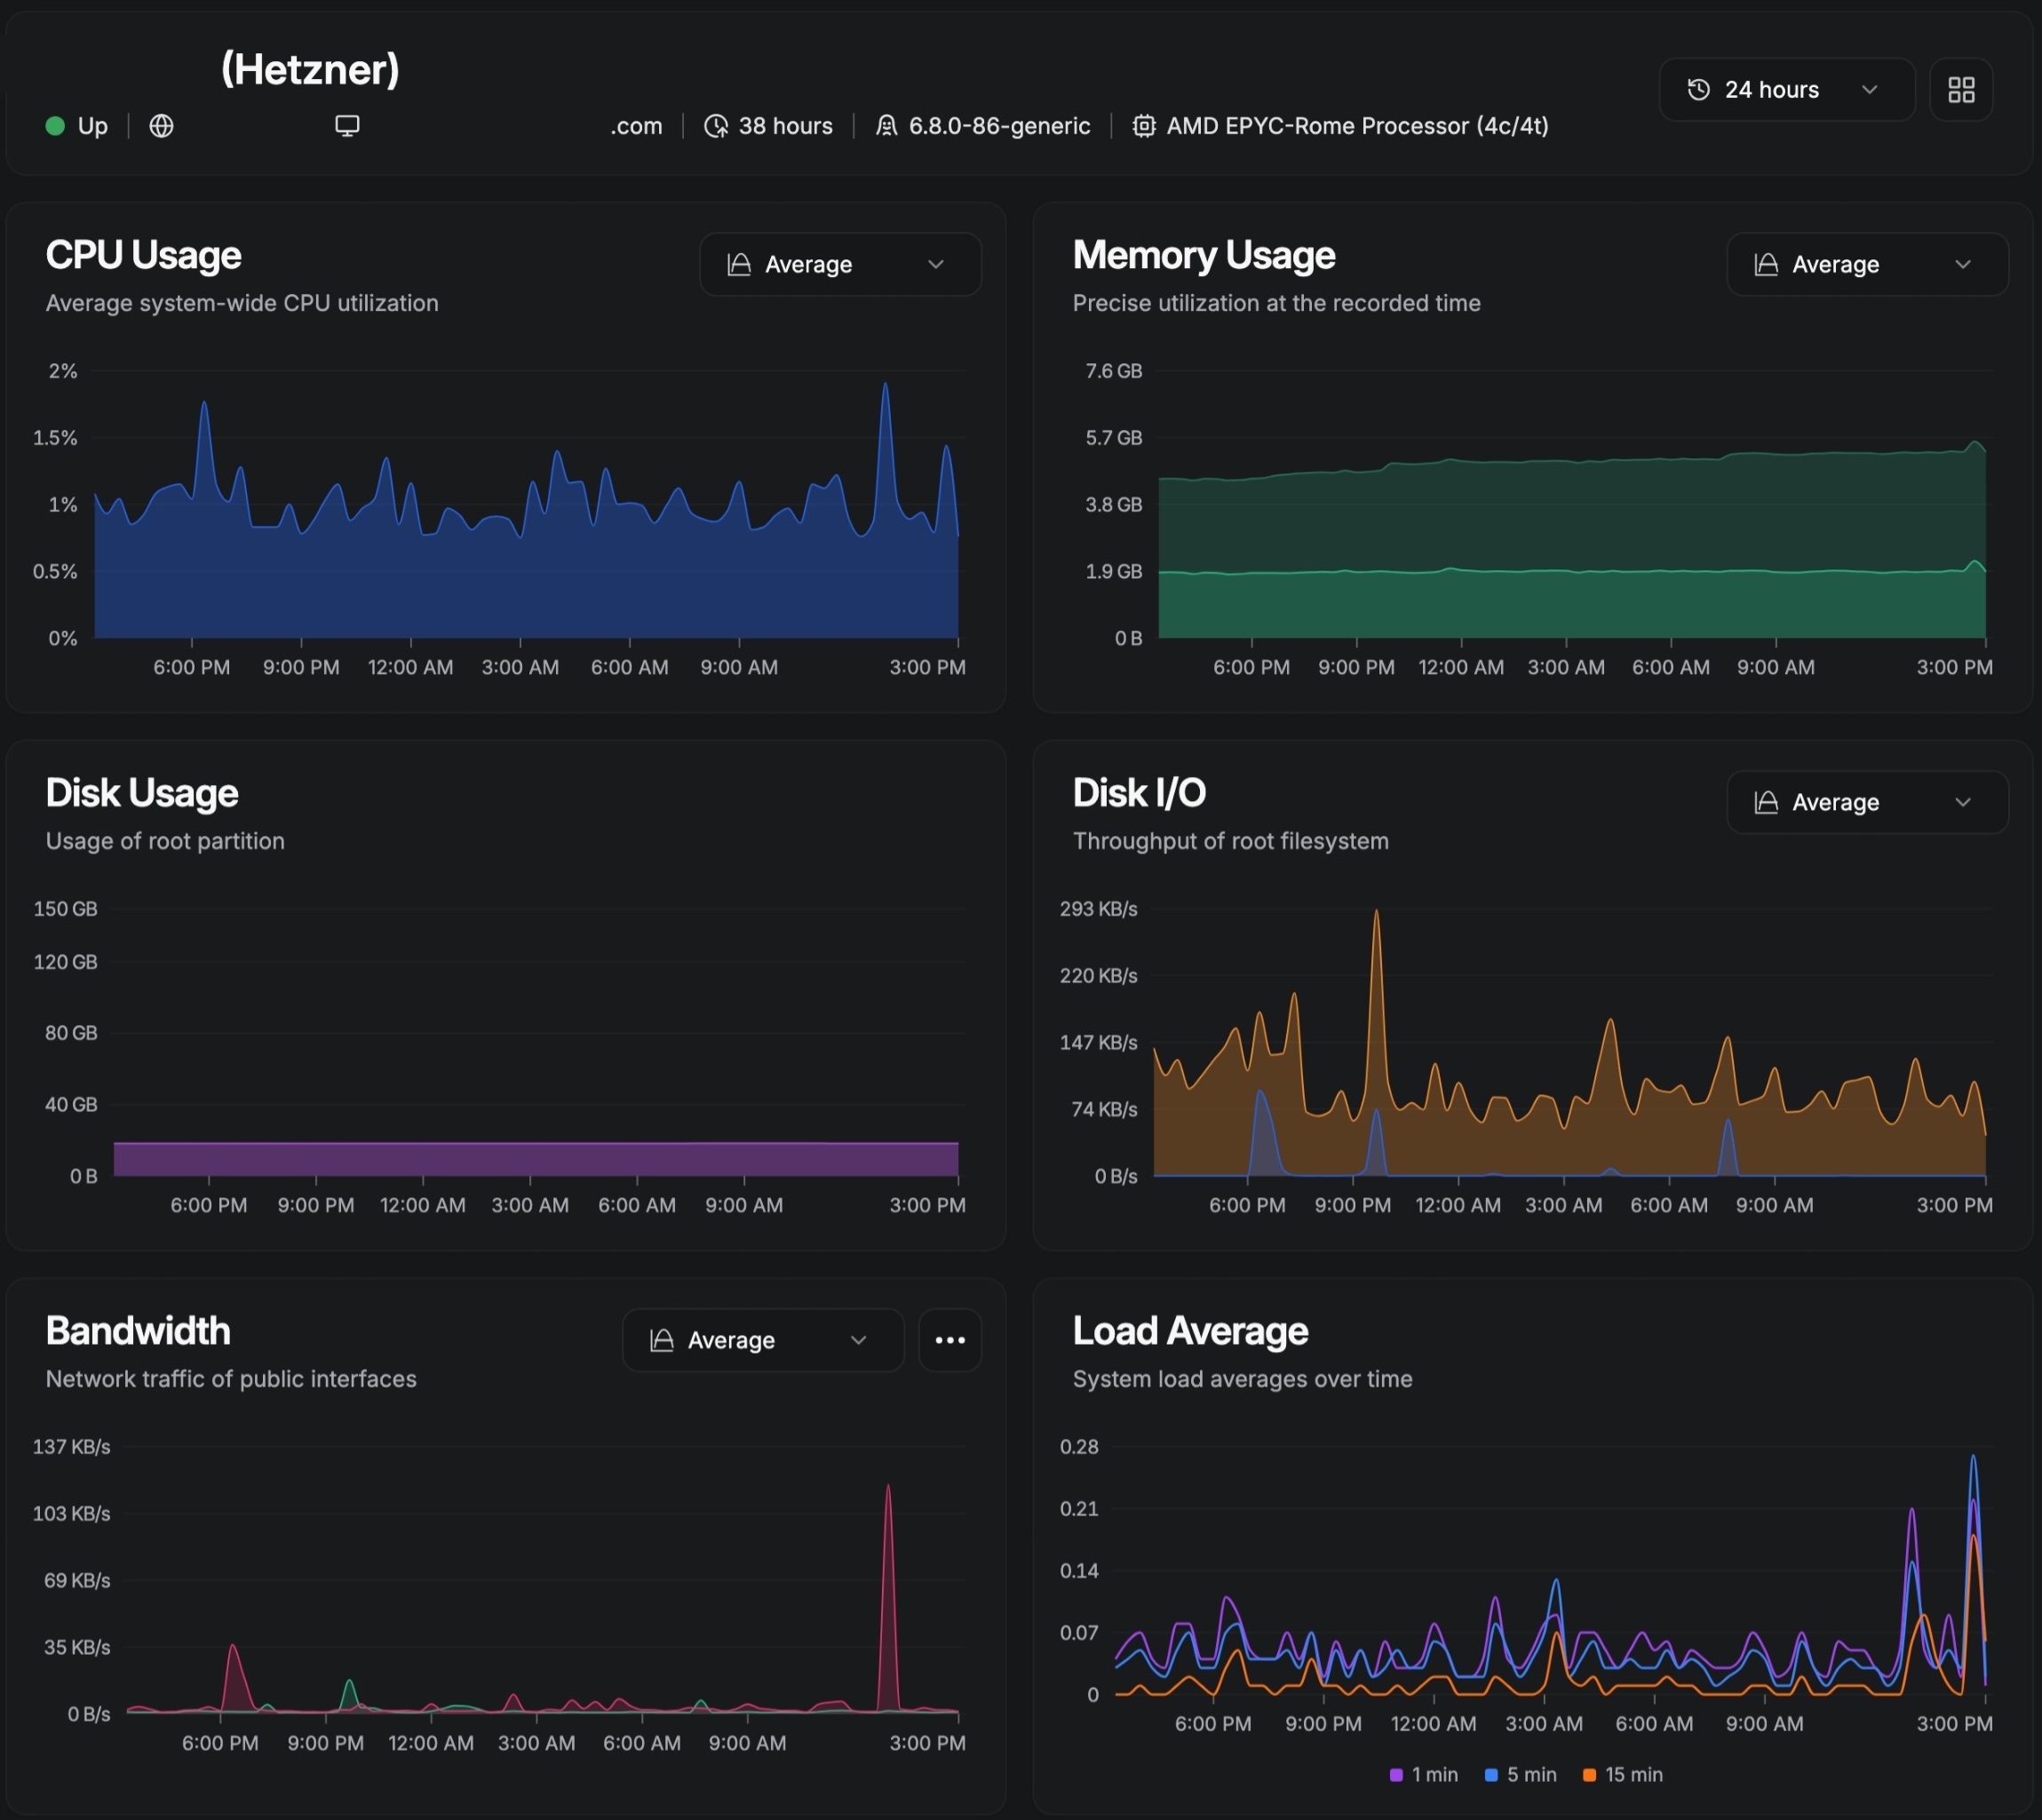
Every agency learns the same lesson exactly once: the outage you discover from a client email costs ten times the outage you discover from a dashboard. Monitoring is what separates professional hosting from hopeful hosting. This guide covers what web agencies should watch on every VPS under management, from CPU graphs to kernel versions, and why each signal earns its place.
CPU: the first graph to read
Processor utilization is the fastest summary of server health. Sustained high CPU means the workload exceeds the container, while sharp recurring spikes point to cron jobs, backup windows, or runaway processes worth rescheduling. Track per-site CPU rather than host-level averages alone, since one hungry neighbor can mask an otherwise idle fleet. Set alerts on sustained load relative to core count, not on momentary peaks, and keep a history measured in months so gradual growth reads as a trend instead of a surprise.
CPU steal time deserves special attention on virtual servers. Consistent steal means the physical host is oversubscribed and your VPS waits its turn for cycles no dashboard inside the container can explain. When steal climbs, the remedy is a conversation with the provider or a migration, not more tuning. Agencies should record steal alongside utilization so provider discussions rest on evidence.
RAM: watch the slope, not the number
Memory usage near capacity is normal on a well-provisioned Linux server. The signal that matters is the slope. A footprint climbing a few percent each week indicates a leak, an unbounded cache, or a process that never releases what it borrows. Pair total usage with per-process breakdowns so the culprit is visible: PHP workers, MySQL buffers, Redis, or something nobody remembers installing.
Out-of-memory kills are the failure mode to prevent, because the kernel chooses the victim and rarely chooses well. Size PHP pools and database buffers so their combined worst case fits inside the container with headroom, cap caches with eviction policies, and alert well before exhaustion. A server that has never OOM-killed a process is a server whose memory budget was planned rather than hoped for.
Disk: capacity and velocity
Disk monitoring has two axes. Capacity is the obvious one: alert at eighty percent, act with urgency past ninety, and track growth rate so a site adding gigabytes monthly gets a larger volume or a cleanup plan before the crisis. Logs, backups staged locally, and media libraries are the usual suspects behind sudden growth, and each has a routine remedy once visible.
Velocity matters just as much. Disk I/O saturation turns a server with free CPU and RAM into a slow one, and the symptoms masquerade as everything else: sluggish admin panels, intermittent timeouts, failing cron runs. Monitor I/O wait and throughput alongside capacity, and treat sustained I/O pressure as a scaling or architecture discussion, Covering faster storage, query optimization, or moving hot data to appropriate tiers, rather than a mystery to endure.
Network: traffic, errors, and exposure
Bandwidth graphs tell stories: the steady climb of a growing client, the midnight spike of a backup window, the sudden flood of an attack or a viral post. Alert on abnormal volume in either direction, since a sharp drop can mean an upstream outage just as surely as a spike means a surge. Track interface errors and retransmits too, because degraded networking produces the intermittent failures that waste the most debugging hours.
Monitor exposure alongside traffic. Every open port and every DNS record pointing at the origin should exist for a documented reason. Stale records aimed at retired servers are security findings, not clutter, and an origin address visible outside the CDN bypasses every edge rule at once. A quarterly network review that reconciles listening ports against firewall policy closes holes that accumulate silently.
Services: every daemon earns its check
Each running service deserves an explicit health check: web server, PHP pools, database, cache daemons, mail transfer, cron scheduler, and the control panel’s own agents. Process-level checks confirm the daemon runs. Functional checks confirm it works, which is a stricter and more useful standard. A PHP pool that accepts connections but never answers is running and broken simultaneously, and only a request-level probe distinguishes the two.
- Process checks for every managed daemon, alerting on unexpected stops.
- Functional probes: an HTTP request for the web stack, a test query for the database, a cache round-trip for Redis or Memcached.
- Certificate and license checks so expiries surface weeks ahead, not hours.
- Backup job verification, because a backup daemon running without completing jobs is silent data loss.
Uptime: external eyes only
Uptime checks must originate outside the infrastructure they watch. A monitor on the same host reports green through the very outage it should catch. Check from multiple regions every few minutes, against the homepage and at least one transactional endpoint for dynamic sites, and route alerts to a channel with a human on the other end. Measure response time alongside availability: a site answering in nine seconds is technically up and practically down.
Publish the resulting reliability record internally per client. Months of measured uptime convert directly into renewal conversations, while honest accounting of incidents, with causes and fixes, builds the trust that survives the occasional bad night. Agencies that can show the numbers keep clients. Agencies that cannot, explain.
Alerts: signal, not noise
An alerting system nobody trusts is decoration. Alert on state changes and anomalies that demand action: services down, disk beyond thresholds, new error classes in logs, certificates nearing expiry. Never alert on routine blocked threats or informational transitions, and aggregate ruthlessly so one incident produces one notification instead of forty. Every alert type needs a runbook entry describing the first three actions, so on-call response is execution rather than improvisation.
Review alert history monthly. Alerts that always resolve themselves need higher thresholds or removal. Alerts that recurred without permanent fixes need engineering time, not more notifications. The healthiest monitoring culture treats each alert as a candidate for automation: today’s 3am page should become tomorrow’s self-healing routine or next quarter’s eliminated failure mode.
Updates and kernel: monitor the maintenance itself
Monitoring should watch the maintenance program, not just the servers. Track available updates per site so nothing drifts months behind, flag end-of-life PHP and operating-system releases while migration remains a planned project rather than an emergency, and confirm that scheduled jobs actually completed: backups finished, scans ran, log rotation kept pace. A maintenance task that fails silently is worse than no task at all, because it manufactures false confidence.
Kernel versions deserve explicit tracking on every VPS. Know which release each server runs, whether a pending update requires a reboot, and when that reboot is scheduled inside an overnight window. After each reboot, verify service recovery automatically rather than assuming it. The servers that surprise you are the ones whose maintenance you stopped watching.
Why agencies monitor differently
A single-site owner monitors to avoid downtime. An agency monitors to protect dozens of client relationships at once, which changes the economics completely. Centralized dashboards across the fleet turn isolated blips into patterns: the plugin update degrading performance on six sites simultaneously, the botnet probing every client login page tonight, the provider issue touching one availability zone. Fleet-wide visibility converts ten separate mysteries into one investigation.
Monitoring is also a product story. Clients rarely see the graphs, but they feel the results: sites that stay fast, incidents resolved before the first complaint, renewal conversations backed by measured reliability. The agencies that thrive treat monitoring as client-facing work with internal tooling, not internal plumbing. Every alert tuned, every trend caught early, and every incident documented is compound interest on client trust.
See everything, miss nothing
CPU, RAM, disk, network, services, uptime, alerts, updates, and kernel: nine signals that together describe the complete health of a VPS. VPS Watch monitors all of them across every managed server, around the clock, so anomalies become tickets for our engineers instead of surprises for your clients. Get started and put your fleet under watch that never blinks.